Up vs. down candles
In Lesson 3 you learned the body runs from the open to the close. But a body on its own has two ends and no label. Which end is the open? Which is the close? This lesson answers that, and it does it without relying on color.
The rule that never changes
Every candle is one of three kinds, and the rule is pure logic:
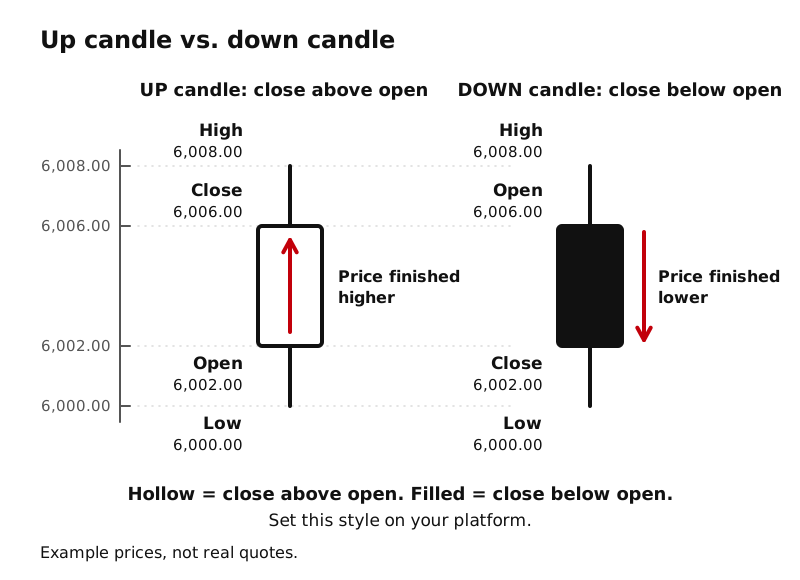
- Up candle: the close is above the open. Price ended the period higher than it started. The open is the bottom of the body; the close is the top.
- Down candle: the close is below the open. Price ended the period lower than it started. The open is the top of the body; the close is the bottom.
- Unchanged: the close equals the open. There is no body height at all, just a flat line across the wicks. (Lesson 5 covers this shape.)
That rule is true on every platform, in every market, with every color scheme. If you know the open and close, you know the candle’s direction. You may also hear up candles called bullish and down candles called bearish; Schwab’s chart reading guide uses those words for candles that close above or below their open. Those words only describe what happened inside that period; they say nothing about what happens next.
How a chart shows which kind it is: fill
A chart has to show you the direction without making you hover over every candle. The clearest way that does not depend on color is the fill of the body:
- Hollow body (outline only, empty inside): close above open, an up candle.
- Filled body (solid inside): close below open, a down candle.
This hollow vs. filled style is a convention, not a law of nature, and it is a setting you choose in your charting software. TradingView, for example, offers a Hollow candles chart type in its chart type menu, where a candle is hollow or filled depending on whether the close is above or below the open, and its settings let you change the colors of the bodies, borders, and wicks. LearnToTick draws every candle in this course that way, with text labels as well, so you never have to guess.
A memory hook: an up candle is “empty” because price rose up out of it. A down candle is “full” because price sank down into it. Use whatever hook works for you, but always check it against the rule above.
What about red and green?
Many charts you see online color candles instead. CME Group’s course mentions the common default: an up candle is generally green and a down candle generally red, and it adds that this depends on the color settings of your software. In other words, color is a default, and you can change it. Color can even mean something else: on TradingView’s Hollow candles chart, the fill shows close vs. open, but the color compares the close with the previous candle’s close.
Do not build your reading on color. Some people cannot easily tell red from green, screens and printouts vary, and different platforms use different defaults. Read the candle by where the open and close sit, and set your chart to a fill style you can see clearly, such as hollow for up and filled for down. If your platform also colors candles, treat the color as a bonus, never as the only clue.
Practice reading direction
Example prices, not real quotes. Decide each candle’s direction yourself, then check it against the explanation.
- Open 6,010.00, close 6,014.50. The close is higher, so it is an up candle: on a hollow/filled chart it is hollow.
- Open 20,120.00, close 20,101.25. The close is lower, so it is a down candle: filled.
- Open 6,003.25, close 6,003.25. Open equals close, so it is unchanged: a flat line for a body.
Key ideas
- Up candle: close above open. Down candle: close below open. Unchanged: close equals open.
- On an up candle the open is the bottom of the body; on a down candle the open is the top.
- A common, settable convention: hollow body = close above open, filled body = close below open.
- Red and green are only a platform default you can change. Never rely on color alone.
- “Bullish” and “bearish” describe what one period did, not what comes next.