Common candle shapes
Traders have given names to certain candle shapes so they can talk about a chart quickly. “There’s a doji at the high” is faster than “the open and close were almost equal there”. This lesson teaches three of the most common names as vocabulary, so you recognize them when you hear them.
Read this part twice: these shapes are names, not signals. CME Group’s own technical analysis course reminds traders that chart patterns are indications, not absolute rules about what the market will do next. A named shape tells you what happened. It does not tell you what will happen.
Doji (one candle)
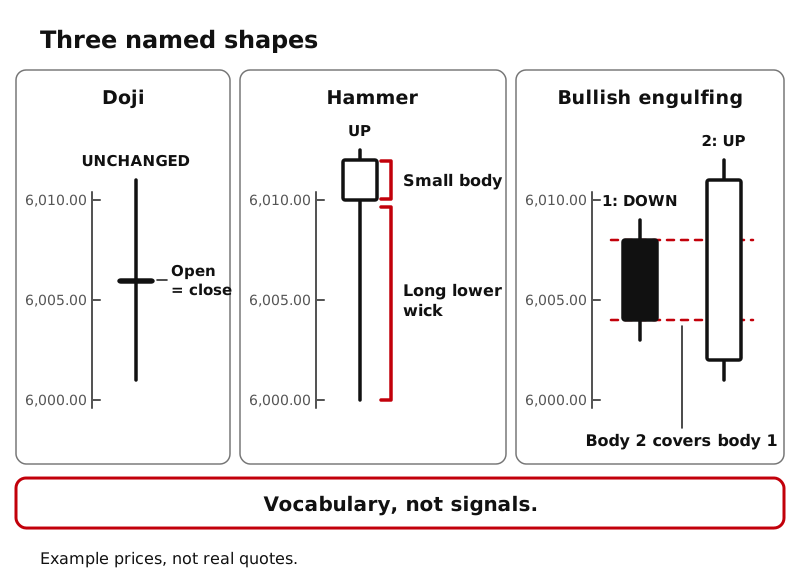
You met the doji in Lesson 5. A doji is a candle where the open and close are equal or nearly equal, so the body is a thin horizontal line. The wicks can be any length; TradingView’s help page notes the candle can look like a cross, an inverted cross, or a plus sign.
What it describes: price moved during the period but finished where it started. Neither side finished ahead.
Hammer (one candle)
A hammer has:
- a small body sitting near the top of the candle,
- a long lower wick hanging below it.
It looks like a hammer: a short head on a long handle. TradingView’s help page describes it as a square attached to a long stick. The body can be hollow or filled; what matters is the shape. TradingView also notes the name “hammer” is used when the shape forms during a decline.
What it describes: during the period, price moved well below the open, then rallied to close well above the low. CME’s candlestick lesson describes a small body near the top of the bar as buyers taking control late in the period.
The upside-down version (small body near the bottom, long upper wick) is called a shooting star when it appears during an uptrend and an inverted hammer when it appears during a downtrend, according to TradingView’s help pages. Schwab describes the shooting star as a period where price rallied well above the open, then was pushed back down to close near the open. Again, just names.
Engulfing (two candles)
An engulfing pattern uses two candles side by side:
- The first candle has a body of some size.
- The second candle’s body is longer and completely covers the first candle’s body, top to bottom, and it closes in the opposite direction.
So a filled (down) candle followed by a bigger hollow (up) candle whose body covers it is called a bullish engulfing. A hollow (up) candle followed by a bigger filled (down) candle whose body covers it is called a bearish engulfing. Only the bodies count; the wicks are ignored for this definition. TradingView’s engulfing pages make the same point: the second body must cover the first body’s open and close, not its whole high to low range. Schwab’s description of the bearish engulfing matches: a bearish second candle whose body completely engulfs the first.
What it describes: in the second period, price moved beyond the whole first body in the other direction.
Why learn names that are not signals?
Because they are the language of charts. You will hear these words in every trading room, video, and book. Knowing them lets you follow a conversation, describe what you see accurately, and ask good questions. A clerk who knows the vocabulary can read the ledger; that is the skill this level is building.
What you should not do is treat any of these shapes as an instruction. The same shape shows up in many places on a chart, and what happens after it varies. Context, which you will study in later levels, matters far more than any single candle.
Key ideas
- Doji: open and close equal or nearly equal; body is a thin line.
- Hammer: small body near the top, long lower wick below it.
- Engulfing: two candles; the second body completely covers the first body and closes the opposite way.
- Bullish and bearish versions describe direction only.
- These are vocabulary, not signals. A named shape describes the past, not the future.