Losing streaks
Sooner or later you will lose five, six, maybe more trades in a row. When it happens, it will feel personal, as if something is broken. Sometimes something is. Most of the time, it is just chance doing what chance does. This lesson gives you the math to tell the difference, and a calm way to handle the run while it is happening.
The math of streaks
All numbers in this section are arithmetic, not market data. They assume, to keep it simple, that every trade has the same chance of winning and that each trade’s result does not depend on the last one. Real trading is messier, but the math shows the shape of the problem.
On the next few trades
Suppose your win rate is 50 percent, so each trade has a 0.5 chance of losing. The chance that the next 5 trades all lose is:
0.5 x 0.5 x 0.5 x 0.5 x 0.5 = 0.5^5 = 0.03125, or about 3.1 percent.
That looks rare. Now the same idea with a 40 percent win rate (0.6 chance of losing each trade):
0.6^5 = 0.07776, or about 7.8 percent.
Over many trades
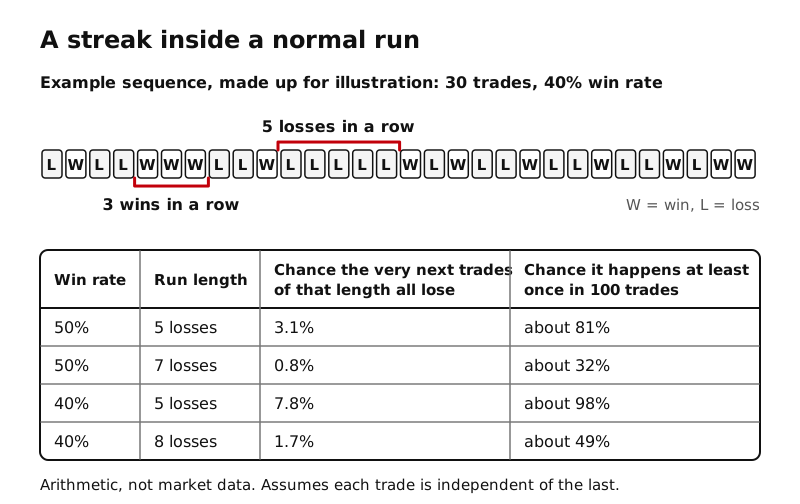
Here is the part that surprises people. The question is not “will the next 5 lose?” but “will a run of 5 losses happen somewhere in my next 100 trades?” Working that out step by step over all 100 trades (a standard counting method, done by computer) gives:
| Win rate | Run length | Chance the very next trades of that length all lose | Chance it happens at least once in 100 trades |
|---|---|---|---|
| 50% | 5 losses | 3.1% | about 81% |
| 50% | 7 losses | 0.8% | about 32% |
| 40% | 5 losses | 7.8% | about 98% |
| 40% | 8 losses | 1.7% | about 49% |
Read the bottom-right numbers again. With a 40 percent win rate, which Local Lesson 6 showed can still be a profitable process when wins are bigger than losses, a run of 5 losses in a row is almost certain somewhere in 100 trades, and a run of 8 is about a coin flip. A losing streak is not proof that anything is wrong.
Why streaks feel like more than chance
The Nobel committee’s background on Kahneman’s work describes how people misjudge random sequences:
- People tend to treat a small sample as if it were as reliable as a large one. Kahneman and Tversky called this the “law of small numbers.” Five losses feel like a verdict on your method, but five trades is a tiny sample.
- The gambler’s fallacy: after a run of one result, people expect the other result to be “due,” even when each event is independent. After five losses, “the next one has to win” is the same mistake in reverse. It is also how a streak leads to a bigger, revenge-sized trade (Lesson 3).
Bad run or broken process?
Your journal (Lesson 8) is how you tell the difference. Ask these questions about the losing trades:
- Did I follow my rules on every trade? If not, the problem is discipline, not the method.
- Were the losses the planned size? If losses grew beyond your planned risk, fix that first.
- Were these trades on my written list? Unplanned trades are a process leak.
- Has something changed? A different time of day, a new instrument, a change in how the market is moving, or a change in you (sleep, stress).
- Is the sample big enough? Judge your process over many trades, not a handful.
If the answers are “yes, yes, yes, nothing changed,” you are most likely in a normal run. If not, you have something concrete to fix.
What to do during a streak
- Do not raise size to win it back. Your rules may even call for lowering it.
- Keep following the plan. Abandoning it after a normal run guarantees you will never know whether it works.
- Respect your daily loss limit (Local Lesson 7). Streaks inside one day are where tilt starts.
- Step back to the bigger sample in your weekly review (Lesson 9).
Key ideas
- Losing streaks are normal. Over 100 trades, a run of 5 losses is about 81% likely at a 50% win rate and about 98% likely at a 40% win rate (arithmetic, assuming independent trades).
- Small samples mislead. The “law of small numbers” and the gambler’s fallacy make streaks feel meaningful.
- Use your journal to separate a bad run (rules followed, normal losses) from a broken process (rules broken, losses too big, something changed).
- During a streak: no size increases, keep following the plan, respect the daily loss limit.