Measuring performance
Your journal (Lesson 8) holds the raw data. Your weekly review (Lesson 9) looks for patterns. This lesson gives you four numbers that turn a pile of trades into a clear picture: win rate, average win and average loss, expectancy, and max drawdown. They are all simple arithmetic you can do in a spreadsheet.
The example
Every number in this lesson comes from one made-up set of 10 trades, invented to show the math. These are not real results.
| Trade | Result | Running total |
|---|---|---|
| 1 | +$50 | $50 |
| 2 | +$30 | $80 |
| 3 | -$40 | $40 |
| 4 | -$35 | $5 |
| 5 | -$30 | -$25 |
| 6 | +$70 | $45 |
| 7 | +$60 | $105 |
| 8 | -$45 | $60 |
| 9 | +$40 | $100 |
| 10 | -$20 | $80 |
Net result: +$80 over 10 trades.
1. Win rate
Win rate = number of winning trades / total number of trades
Winners are trades 1, 2, 6, 7, and 9: five of them.
Win rate = 5 / 10 = 50 percent. The loss rate is the rest: 5 / 10 = 50 percent.
On its own, win rate says almost nothing about whether you make money. Local Lesson 6 showed why: a 40 percent win rate can make money and a 70 percent win rate can lose it, depending on the size of wins and losses.
2. Average win and average loss
Average win = total of winning trades / number of winning trades
($50 + $30 + $70 + $60 + $40) / 5 = $250 / 5 = $50
Average loss = total of losing trades / number of losing trades (written as a positive number)
($40 + $35 + $30 + $45 + $20) / 5 = $170 / 5 = $34
Comparing these two tells you whether your winners are paying for your losers. Lesson 2’s “cutting winners early” habit shows up here as a shrinking average win.
3. Expectancy
Expectancy combines the first two into one number: what the process made per trade, on average, over this sample. This is the same formula you met in Local Lesson 6:
Expectancy = (win rate x average win) minus (loss rate x average loss)
(0.50 x $50) minus (0.50 x $34) = $25 minus $17 = +$8 per trade
Check it another way: net result / number of trades = $80 / 10 = $8. Same answer.
A positive expectancy means that, over this sample, the process made money on average. A negative one means it lost. It is a description of past trades, not a promise about future ones.
4. Max drawdown
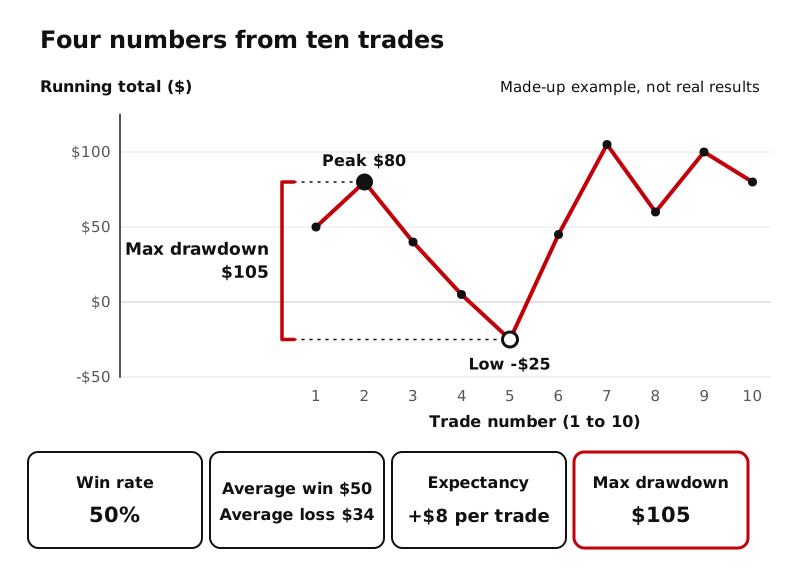
Drawdown is a drop in your running balance from a high point (a peak) to a later low point, before the balance makes a new high. Max drawdown is the largest such drop in the sample. You met the idea of drawdown in Local Lesson 8.
Follow the running total in the table:
- It reaches $80 after trade 2 (a peak).
- It falls to -$25 after trade 5 (the low before the next high).
- Drop: $80 minus (-$25) = $105.
- Later it peaks at $105 after trade 7 and falls to $60 after trade 8: a drop of $45.
The larger drop is $105, so max drawdown = $105.
Notice that the max drawdown ($105) is bigger than the whole net profit ($80). That can happen, and it is important to see: to earn that $80, this trader had to sit through a $105 drop. Max drawdown tells you how much pain the process puts you through, and it is worth knowing before you set your risk limits.
Sample size: the big warning
Ten trades is far too few to trust any of these numbers. Lesson 6 explained the “law of small numbers,” the tendency described in the Nobel committee’s background on Kahneman’s work to treat a small sample as if it told the whole story. One lucky or unlucky trade can swing a 10 trade expectancy completely.
Collect a large number of trades, following the same rules, before you draw conclusions. And measure your rule-following trades separately from the rule breaks. If the rule-following trades have positive expectancy and the rule breaks are dragging you down, you know exactly what to fix.
Key ideas
- Win rate = wins / total trades. Alone, it says little.
- Average win and average loss show whether winners pay for losers.
- Expectancy = (win rate x average win) minus (loss rate x average loss): the average result per trade.
- Max drawdown = the largest peak-to-low drop in your running balance.
- Small samples mislead. Use many trades, and measure rule-following trades separately.