Swing highs and lows
In Lesson 1 you learned to say “trend,” “range,” or “chop.” That was a gut description. This lesson gives you a way to describe a trend precisely, using the turning points on a chart.
Swing highs and swing lows
Price never moves in a straight line. It zigzags. Every zigzag has peaks and troughs.
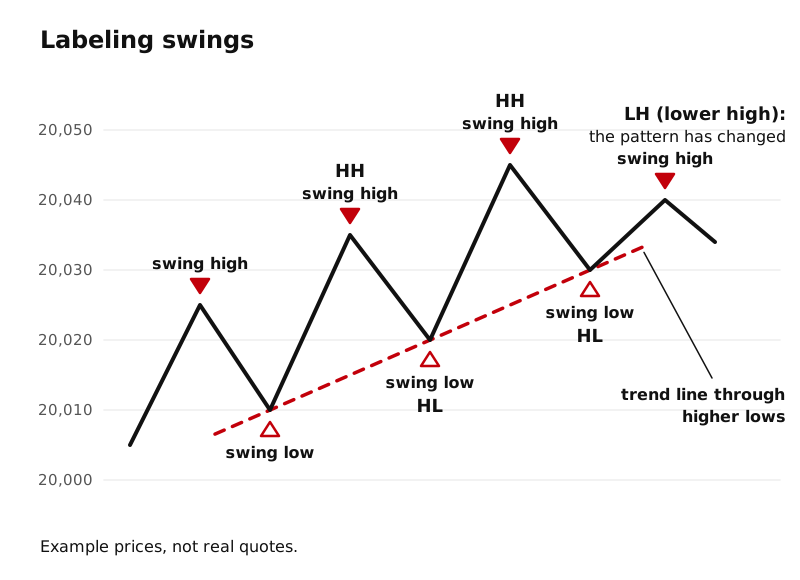
- A swing high is a peak: a high where price stopped going up and turned back down. The bars on either side of it have lower highs.
- A swing low is a trough: a low where price stopped going down and turned back up. The bars on either side of it have higher lows.
TradingView’s Pivot Points High Low indicator uses exactly this test: a pivot high has bars with lower highs on either side of it, and a pivot low has bars with higher lows on either side. Traders often shorten these to “swing points” or just “swings.” CME Group’s support and resistance lesson calls them previous highs and lows and notes that technical analysts pay attention to them because markets often pause near earlier highs and lows.
Comparing one swing to the next
Once you have marked the swings, compare each one to the swing of the same kind before it. There are only four possible results:
| Compared to the previous one | Name | Short form |
|---|---|---|
| New swing high is above the last swing high | Higher high | HH |
| New swing high is below the last swing high | Lower high | LH |
| New swing low is above the last swing low | Higher low | HL |
| New swing low is below the last swing low | Lower low | LL |
CME Group’s course on reversal patterns uses exactly this vocabulary. It describes a top forming when price makes higher highs and then a lower high, and a bottom forming when price makes lower lows and then a higher low.
How swings define a trend
Put the four labels together and you get a precise description of trend. Schwab’s chart reading guide uses the same definition: higher highs and higher lows for an uptrend, lower highs and lower lows for a downtrend.
- Uptrend: higher highs and higher lows. Each peak beats the last peak, and each pullback stops above the last pullback.
- Downtrend: lower highs and lower lows. Each bounce fails below the last bounce, and each drop goes below the last drop.
- Range: swing highs land at about the same level, and swing lows land at about the same level.
- Mixed (often chop): the labels disagree, for example higher highs with lower lows, so the swings get wider in both directions.
CME’s support and resistance lesson adds a related idea: in a rising market, a trend line can be drawn through a series of rising lows. That only works because the lows are higher lows.
The catch: swings are only clear afterward
Here is the part beginners miss. You cannot know a high is a swing high while price is still making it. It only becomes a swing high after price moves away from it and the bars after it have lower highs. That follows from the definition: TradingView’s pivot indicator needs a set number of bars with lower highs on both sides, so the right-hand bars have to print first. Until then, it is just “the high so far.”
This is why CME’s reversal lesson warns that tops and bottoms are hard to predict in real time and are often only clear after the pattern has finished.
So when you label swings, you are labeling the past. That is useful: it tells you the structure of the market so far. It does not tell you what the next swing will be.
One lower high is not a reversal
In an uptrend, a single lower high does not mean the trend is over. It means the pattern has been broken once. Some traders wait for more confirmation before they change the label. Schwab’s chart reading guide gives an example in the mirror image: after a downtrend, look for at least one higher high and one higher low before calling it an uptrend. There is no single official rule, and that is fine. What matters is that you describe what you see consistently.
Swing structure is a description, never a signal by itself. It tells you how the market has been moving, not what you should do next.
Key ideas
- A swing high is a peak where price turned down; a swing low is a trough where price turned up.
- Compare each swing to the last one: higher high, lower high, higher low, lower low.
- Uptrend: higher highs and higher lows. Downtrend: lower highs and lower lows.
- Swings are only confirmed after price moves away, so swing labels describe the past, not the future.