Volume profile
Clerk Lesson 8 covered volume, which most charts show as bars along the bottom: how much traded in each time period. A volume profile turns that sideways. It shows how much traded at each price.
TradingView’s help center describes a volume profile as showing trading activity over a time period at specified price levels. Put simply, volume bars show when trading happened; a volume profile shows where it happened.
What it looks like
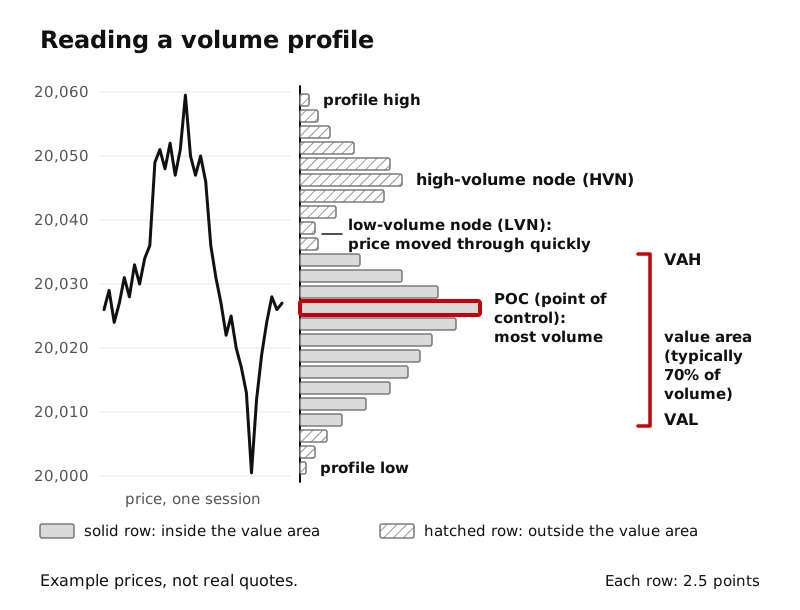
A volume profile is a horizontal histogram drawn against the price axis. Each row is a small band of prices. The longer the row, the more contracts traded at those prices during the period you chose.
The period is your choice. TradingView, for example, offers session, fixed range, visible range, periodic, and auto anchored versions, so the profile can cover one session, a stretch you pick, or whatever is on screen.
The key labels
TradingView’s documentation names the typical levels of a profile. In plain words:
- Point of control (POC): the single price level with the most volume in the period. It is the longest row of the histogram.
- Profile high and profile low: the highest and lowest prices traded in the period.
- Value area (VA): the range of prices where a chosen percentage of all the volume traded. TradingView says this percentage is typically set to 70 percent, and that it is up to the trader.
- Value area high (VAH) and value area low (VAL): the top and bottom edges of the value area.
How the value area is built
TradingView describes the method step by step. Simplified:
- Start at the POC and count its volume.
- Look at the next row above and the next row below. Add whichever has more volume.
- Repeat, always adding the heavier neighbor, until the rows you have added reach the target share of total volume (for example 70 percent).
- The top row included is the VAH; the bottom row is the VAL.
So the value area is not just “the middle 70 percent of the price range.” It grows outward from the POC toward wherever the volume is heaviest.
A worked example
Made-up numbers for practice, not real data. A profile has total volume of 10,000 contracts, and you use a 70 percent value area.
- Target volume: 10,000 times 0.70 = 7,000 contracts.
- The value area is built outward from the POC until the included rows hold about 7,000 contracts. The remaining 3,000 or so traded at prices above the VAH or below the VAL.
High- and low-volume nodes
Look at the shape of the histogram and you will see bumps and dips.
- High-volume nodes (HVN) are the peaks: price areas where a lot of volume traded. TradingView describes these as zones where price spent a long time while buyers and sellers did a lot of business.
- Low-volume nodes (LVN) are the valleys: price areas where little volume traded. TradingView notes these often form where price moved through a level quickly, for example during a fast move up or down.
How traders talk about it
You will hear traders describe profile levels the same way they describe other levels from Lesson 3: as places that might act as support or resistance, because they mark where the market did a lot of business before. TradingView’s documentation makes an honest point worth repeating: a volume profile is a reactive tool. It shows what already happened, not what will happen next.
Two more cautions:
- Different periods, different profiles. A one-session profile and a one-week profile of the same market have different POCs and value areas. Always know which period you are looking at.
- Settings matter. The value area percentage and the row size are settings. Change them and the levels move. That is fine, as long as you keep them consistent.
None of these levels is a signal by itself. They are a way of describing where the market traded the most and the least.
Key ideas
- A volume profile shows how much volume traded at each price, as a sideways histogram.
- POC is the price with the most volume. The value area holds a chosen share of the volume, typically 70 percent, between the VAH and VAL.
- High-volume nodes are peaks where a lot traded; low-volume nodes are valleys where little traded.
- Volume profile describes the past. Its levels are references, never signals by themselves.